Stay Ahead in Fast-Growing Economies.
Browse Reports Now


Electronic Navigational Charts Market Size, Share, Growth & Forecast (2024-2032)
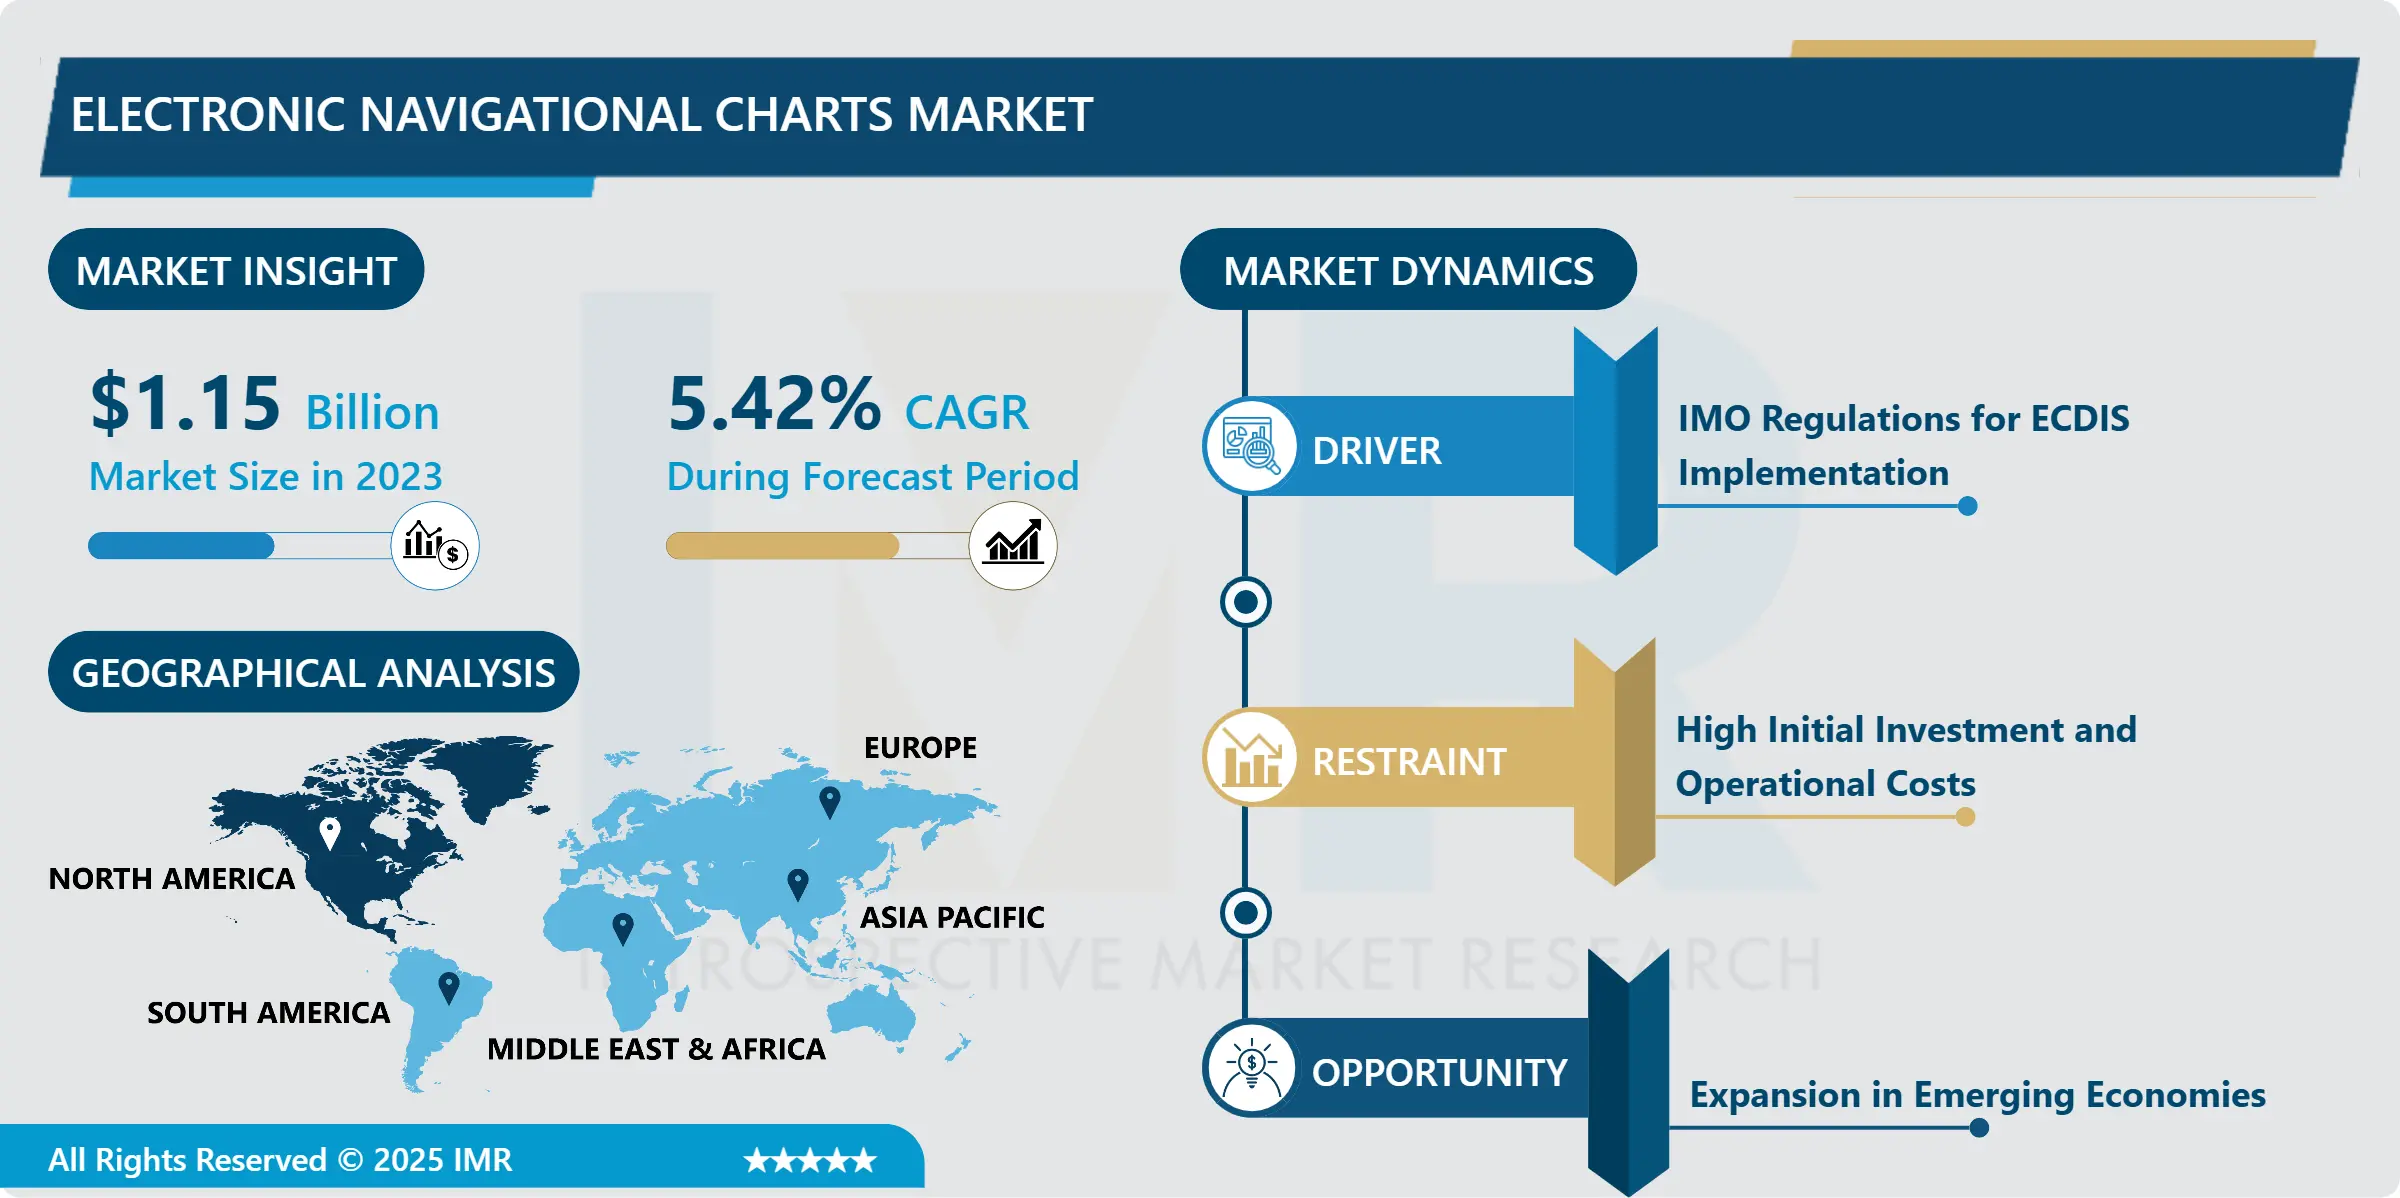
Electronic Navigational Charts Market Size Was Valued at USD 1.15 Billion in 2023, and is Projected to Reach USD 1.85 Billion by 2032, Growing at a CAGR of 5.42% From 2024-2032.

IMR Group
Description
Electronic Navigational Charts Market Synopsis:
Electronic Navigational Charts Market Size Was Valued at USD 1.15 Billion in 2023, and is Projected to Reach USD 1.85 Billion by 2032, Growing at a CAGR of 5.42% From 2024-2032.
The Electronic Navigational Charts (ENC) Market entails the creation of, and distribution of Geographic Information System (GIS) solutions that are used to navigate through seas and oceans. ENCs are a type of geospatial data that is delivered in standardized form to optimize the safety and efficiency of vessel navigation in an electronic manner in lieu of a paper chart. These charts are very popular in business and military used to improve performance, safety and conformity to IMA rules and regulations.
Electronic Navigational Charts have greatly impacted the maritime industry by providing detailed accurate and constantly changing navigational data. Moreover, ENCs employ dynamic data compared to the paper edition: water depth alterations, coastal breakthroughs and changes, various dangers, and landmarks involved in maritime operations. However ENCs, are adopted primarily by International Maritime Organization’s (IMO) regulations that require the use of electronic chart display and information systems (ECDIS) on specific categories of vessels.
Terms such as satellite technology, GPS, and enhanced focus on marine safety are pushing the market. Higher volumes of trade transactions and a rising sea-going tonnage add additional pressures to the demand for ENCs. Hydrographic offices of the regions and private companies are directly involved in chart production and dissemination. Nevertheless, the market is not without its problems for example high implementation costs and the fact that crews have to undergo extensive training.
Electronic Navigational Charts Market Trend Analysis
Growing Adoption of AI-Driven Navigation Systems
Adoption of artificial intelligence into navigational systems is a trend that has emerged in the market for ENC. Artificial intelligent route planning systems use large ENCs in conjunction with weather data and real-time performance data from ships to make real-time adjustments to optimize route, safety and fuel efficiency. Thus, it reduces operating expenses at the same time enhancing the firm’s environmental relevance.
AI systems are most useful in self-driving logistics wherein elaborate algorithms are critical to risk assessment and course determination to avoid more ship collisions. The integration of ENCs with AI means better, safer and effective navigation and operation at sea which makes the use of AI a priority innovation and investment area in the maritime sector.
Expansion in Emerging Economies
Thus, the ENC market is relevant for development intense in terms of continuous enlargement of ports and growth of maritime activities in emerging economies. There has been increasing interest in developing shipping and logistics infrastructure in Asian, African and South American nations thus increasing the uptake of digital navigation equipment.
These regions are also focusing on implementing International Maritime Safety standards to use existing opportunities to widely spread the idea of ENC. The increasing adoption of digital solutions and Government policies towards transforming the sea business interoperations also fuels this growth for which emerging economies are strategic for the market competitors.
Electronic Navigational Charts Market Segment Analysis:
Electronic Navigational Charts Market is Segmented on the basis of Type, Distribution Channel, Application, End User, and Region
By Type, Vector Charts segment is expected to dominate the market during the forecast period
Vector Charts are by far the most frequently employed type of ENCs, partly because they are dynamic, interactive, and may be customized. Based on these charts, it is possible to zoom in and zoom out the data and also to filter the layers differentially as well as to obtain the relevant data of specific regions. It is, therefore, the preferred option for commercial and defense shipping due to their portability and ECDIS compliance.
Raster Charts which are less complex are still like traditional paper charts depicting scanned images. They do not contain interactive characteristics, yet, people view them as simple and effective. Their market share is restricted due to their obsolescence by the relative advantage of vector charts.
By Application, Commercial segment expected to held the largest share
Market: Commercial Applications is the largest segment of the ENC market due to the increased use of digital navigation solutions for various cargos and passengers shipping and port operations globally. These charts make it easier to work in an organization, saves on fuel, and ensures safety in areas that have high traffic rate in the seas.
For Defense Applications are also important, the naval fleets and coast guards also need ENCs for their operation. High speed and value updates, consequently, provide the strategic benefits, specifically in the military sequences and surveillance. These factors and growing geopolitical risks together with the modernisation of naval fleets subsequently drive the demand for ENC in this segment.
Electronic Navigational Charts Market Regional Insights:
North America is Expected to Dominate the Market Over the Forecast period
North America takes the largest share of the ENC market owing to its marvellous maritime infrastructure, a powerful defense system, and high penetration of digital technology. The United States has a lot to gain from large investments in the development of new naval and commercial fleets and strict adherence to IMO standards.
The technological perspective of the region extending from AI implementation to self-driving ships also enhances its position. The North American region remains a potential market for ENC providers due to its increasing concerns about sustainability and safety.
Active Key Players in the Electronic Navigational Charts Market:
Transas Marine (Russia)
Jeppesen Marine (USA)
Navionics (Italy)
ChartWorld International (Germany)
Raytheon Anschütz (Germany)
Tokyo Keiki Inc. (Japan)
Kongsberg Maritime (Norway)
SevenCs GmbH (Germany)
Kelvin Hughes Limited (UK)
IIC Technologies (India)
Garmin Ltd. (USA)
C-MAP (Norway)
Other Active Players
Chapter 1: Introduction
1.1 Scope and Coverage
Chapter 2:Executive Summary
Chapter 3: Market Landscape
3.1 Market Dynamics
3.1.1 Drivers
3.1.2 Restraints
3.1.3 Opportunities
3.1.4 Challenges
3.2 Market Trend Analysis
3.3 PESTLE Analysis
3.4 Porter’s Five Forces Analysis
3.5 Industry Value Chain Analysis
3.6 Ecosystem
3.7 Regulatory Landscape
3.8 Price Trend Analysis
3.9 Patent Analysis
3.10 Technology Evolution
3.11 Investment Pockets
3.12 Import-Export Analysis
Chapter 4: Electronic navigational charts Market by Type
4.1 Electronic navigational charts Market Snapshot and Growth Engine
4.2 Electronic navigational charts Market Overview
4.3 Vector Charts
4.3.1 Introduction and Market Overview
4.3.2 Historic and Forecasted Market Size in Value USD and Volume Units (2017-2032F)
4.3.3 Key Market Trends, Growth Factors and Opportunities
4.3.4 Vector Charts: Geographic Segmentation Analysis
4.4 Raster Charts
4.4.1 Introduction and Market Overview
4.4.2 Historic and Forecasted Market Size in Value USD and Volume Units (2017-2032F)
4.4.3 Key Market Trends, Growth Factors and Opportunities
4.4.4 Raster Charts: Geographic Segmentation Analysis
Chapter 5: Electronic navigational charts Market by Application
5.1 Electronic navigational charts Market Snapshot and Growth Engine
5.2 Electronic navigational charts Market Overview
5.3 Commercial
5.3.1 Introduction and Market Overview
5.3.2 Historic and Forecasted Market Size in Value USD and Volume Units (2017-2032F)
5.3.3 Key Market Trends, Growth Factors and Opportunities
5.3.4 Commercial: Geographic Segmentation Analysis
5.4 Defense
5.4.1 Introduction and Market Overview
5.4.2 Historic and Forecasted Market Size in Value USD and Volume Units (2017-2032F)
5.4.3 Key Market Trends, Growth Factors and Opportunities
5.4.4 Defense: Geographic Segmentation Analysis
Chapter 6: Electronic navigational charts Market by End-User
6.1 Electronic navigational charts Market Snapshot and Growth Engine
6.2 Electronic navigational charts Market Overview
6.3 Shipping Companies
6.3.1 Introduction and Market Overview
6.3.2 Historic and Forecasted Market Size in Value USD and Volume Units (2017-2032F)
6.3.3 Key Market Trends, Growth Factors and Opportunities
6.3.4 Shipping Companies: Geographic Segmentation Analysis
6.4 Port Authorities
6.4.1 Introduction and Market Overview
6.4.2 Historic and Forecasted Market Size in Value USD and Volume Units (2017-2032F)
6.4.3 Key Market Trends, Growth Factors and Opportunities
6.4.4 Port Authorities: Geographic Segmentation Analysis
6.5 Government Organizations
6.5.1 Introduction and Market Overview
6.5.2 Historic and Forecasted Market Size in Value USD and Volume Units (2017-2032F)
6.5.3 Key Market Trends, Growth Factors and Opportunities
6.5.4 Government Organizations: Geographic Segmentation Analysis
6.6 Others
6.6.1 Introduction and Market Overview
6.6.2 Historic and Forecasted Market Size in Value USD and Volume Units (2017-2032F)
6.6.3 Key Market Trends, Growth Factors and Opportunities
6.6.4 Others: Geographic Segmentation Analysis
Chapter 7: Electronic navigational charts Market by Distribution Channel
7.1 Electronic navigational charts Market Snapshot and Growth Engine
7.2 Electronic navigational charts Market Overview
7.3 Online
7.3.1 Introduction and Market Overview
7.3.2 Historic and Forecasted Market Size in Value USD and Volume Units (2017-2032F)
7.3.3 Key Market Trends, Growth Factors and Opportunities
7.3.4 Online: Geographic Segmentation Analysis
7.4 Offline
7.4.1 Introduction and Market Overview
7.4.2 Historic and Forecasted Market Size in Value USD and Volume Units (2017-2032F)
7.4.3 Key Market Trends, Growth Factors and Opportunities
7.4.4 Offline: Geographic Segmentation Analysis
Chapter 8: Company Profiles and Competitive Analysis
8.1 Competitive Landscape
8.1.1 Competitive Benchmarking
8.1.2 Electronic navigational charts Market Share by Manufacturer (2023)
8.1.3 Industry BCG Matrix
8.1.4 Heat Map Analysis
8.1.5 Mergers and Acquisitions
8.2 TRANSAS MARINE (RUSSIA)
8.2.1 Company Overview
8.2.2 Key Executives
8.2.3 Company Snapshot
8.2.4 Role of the Company in the Market
8.2.5 Sustainability and Social Responsibility
8.2.6 Operating Business Segments
8.2.7 Product Portfolio
8.2.8 Business Performance
8.2.9 Key Strategic Moves and Recent Developments
8.2.10 SWOT Analysis
8.3 JEPPESEN MARINE (USA)
8.4 NAVIONICS (ITALY)
8.5 CHARTWORLD INTERNATIONAL (GERMANY)
8.6 RAYTHEON ANSCHÜTZ (GERMANY)
8.7 TOKYO KEIKI INC. (JAPAN)
8.8 KONGSBERG MARITIME (NORWAY)
8.9 SEVENCS GMBH (GERMANY)
8.10 KELVIN HUGHES LIMITED (UK)
8.11 IIC TECHNOLOGIES (INDIA)
8.12 GARMIN LTD. (USA)
8.13 C-MAP (NORWAY)
8.14 OTHER ACTIVE PLAYERS
Chapter 9: Global Electronic navigational charts Market By Region
9.1 Overview
9.2. North America Electronic navigational charts Market
9.2.1 Key Market Trends, Growth Factors and Opportunities
9.2.2 Top Key Companies
9.2.3 Historic and Forecasted Market Size by Segments
9.2.4 Historic and Forecasted Market Size By Type
9.2.4.1 Vector Charts
9.2.4.2 Raster Charts
9.2.5 Historic and Forecasted Market Size By Application
9.2.5.1 Commercial
9.2.5.2 Defense
9.2.6 Historic and Forecasted Market Size By End-User
9.2.6.1 Shipping Companies
9.2.6.2 Port Authorities
9.2.6.3 Government Organizations
9.2.6.4 Others
9.2.7 Historic and Forecasted Market Size By Distribution Channel
9.2.7.1 Online
9.2.7.2 Offline
9.2.8 Historic and Forecast Market Size by Country
9.2.8.1 US
9.2.8.2 Canada
9.2.8.3 Mexico
9.3. Eastern Europe Electronic navigational charts Market
9.3.1 Key Market Trends, Growth Factors and Opportunities
9.3.2 Top Key Companies
9.3.3 Historic and Forecasted Market Size by Segments
9.3.4 Historic and Forecasted Market Size By Type
9.3.4.1 Vector Charts
9.3.4.2 Raster Charts
9.3.5 Historic and Forecasted Market Size By Application
9.3.5.1 Commercial
9.3.5.2 Defense
9.3.6 Historic and Forecasted Market Size By End-User
9.3.6.1 Shipping Companies
9.3.6.2 Port Authorities
9.3.6.3 Government Organizations
9.3.6.4 Others
9.3.7 Historic and Forecasted Market Size By Distribution Channel
9.3.7.1 Online
9.3.7.2 Offline
9.3.8 Historic and Forecast Market Size by Country
9.3.8.1 Russia
9.3.8.2 Bulgaria
9.3.8.3 The Czech Republic
9.3.8.4 Hungary
9.3.8.5 Poland
9.3.8.6 Romania
9.3.8.7 Rest of Eastern Europe
9.4. Western Europe Electronic navigational charts Market
9.4.1 Key Market Trends, Growth Factors and Opportunities
9.4.2 Top Key Companies
9.4.3 Historic and Forecasted Market Size by Segments
9.4.4 Historic and Forecasted Market Size By Type
9.4.4.1 Vector Charts
9.4.4.2 Raster Charts
9.4.5 Historic and Forecasted Market Size By Application
9.4.5.1 Commercial
9.4.5.2 Defense
9.4.6 Historic and Forecasted Market Size By End-User
9.4.6.1 Shipping Companies
9.4.6.2 Port Authorities
9.4.6.3 Government Organizations
9.4.6.4 Others
9.4.7 Historic and Forecasted Market Size By Distribution Channel
9.4.7.1 Online
9.4.7.2 Offline
9.4.8 Historic and Forecast Market Size by Country
9.4.8.1 Germany
9.4.8.2 UK
9.4.8.3 France
9.4.8.4 The Netherlands
9.4.8.5 Italy
9.4.8.6 Spain
9.4.8.7 Rest of Western Europe
9.5. Asia Pacific Electronic navigational charts Market
9.5.1 Key Market Trends, Growth Factors and Opportunities
9.5.2 Top Key Companies
9.5.3 Historic and Forecasted Market Size by Segments
9.5.4 Historic and Forecasted Market Size By Type
9.5.4.1 Vector Charts
9.5.4.2 Raster Charts
9.5.5 Historic and Forecasted Market Size By Application
9.5.5.1 Commercial
9.5.5.2 Defense
9.5.6 Historic and Forecasted Market Size By End-User
9.5.6.1 Shipping Companies
9.5.6.2 Port Authorities
9.5.6.3 Government Organizations
9.5.6.4 Others
9.5.7 Historic and Forecasted Market Size By Distribution Channel
9.5.7.1 Online
9.5.7.2 Offline
9.5.8 Historic and Forecast Market Size by Country
9.5.8.1 China
9.5.8.2 India
9.5.8.3 Japan
9.5.8.4 South Korea
9.5.8.5 Malaysia
9.5.8.6 Thailand
9.5.8.7 Vietnam
9.5.8.8 The Philippines
9.5.8.9 Australia
9.5.8.10 New Zealand
9.5.8.11 Rest of APAC
9.6. Middle East & Africa Electronic navigational charts Market
9.6.1 Key Market Trends, Growth Factors and Opportunities
9.6.2 Top Key Companies
9.6.3 Historic and Forecasted Market Size by Segments
9.6.4 Historic and Forecasted Market Size By Type
9.6.4.1 Vector Charts
9.6.4.2 Raster Charts
9.6.5 Historic and Forecasted Market Size By Application
9.6.5.1 Commercial
9.6.5.2 Defense
9.6.6 Historic and Forecasted Market Size By End-User
9.6.6.1 Shipping Companies
9.6.6.2 Port Authorities
9.6.6.3 Government Organizations
9.6.6.4 Others
9.6.7 Historic and Forecasted Market Size By Distribution Channel
9.6.7.1 Online
9.6.7.2 Offline
9.6.8 Historic and Forecast Market Size by Country
9.6.8.1 Turkiye
9.6.8.2 Bahrain
9.6.8.3 Kuwait
9.6.8.4 Saudi Arabia
9.6.8.5 Qatar
9.6.8.6 UAE
9.6.8.7 Israel
9.6.8.8 South Africa
9.7. South America Electronic navigational charts Market
9.7.1 Key Market Trends, Growth Factors and Opportunities
9.7.2 Top Key Companies
9.7.3 Historic and Forecasted Market Size by Segments
9.7.4 Historic and Forecasted Market Size By Type
9.7.4.1 Vector Charts
9.7.4.2 Raster Charts
9.7.5 Historic and Forecasted Market Size By Application
9.7.5.1 Commercial
9.7.5.2 Defense
9.7.6 Historic and Forecasted Market Size By End-User
9.7.6.1 Shipping Companies
9.7.6.2 Port Authorities
9.7.6.3 Government Organizations
9.7.6.4 Others
9.7.7 Historic and Forecasted Market Size By Distribution Channel
9.7.7.1 Online
9.7.7.2 Offline
9.7.8 Historic and Forecast Market Size by Country
9.7.8.1 Brazil
9.7.8.2 Argentina
9.7.8.3 Rest of SA
Chapter 10 Analyst Viewpoint and Conclusion
10.1 Recommendations and Concluding Analysis
10.2 Potential Market Strategies
Chapter 11 Research Methodology
11.1 Research Process
11.2 Primary Research
11.3 Secondary Research
Q1: What would be the forecast period in the Electronic Navigational Charts Market research report?
A1: The forecast period in the Electronic Navigational Charts Market research report is 2024-2032.
Q2: Who are the key players in the Electronic Navigational Charts Market?
A2: Transas Marine (Russia), Jeppesen Marine (USA), Navionics (Italy), ChartWorld International (Germany), Raytheon Anschütz (Germany), Tokyo Keiki Inc. (Japan), Kongsberg Maritime (Norway), SevenCs GmbH (Germany), Kelvin Hughes Limited (UK), IIC Technologies (India), Garmin Ltd. (USA), C-MAP (Norway), and Other Active Players.
Q3: What are the segments of the Electronic Navigational Charts Market?
A3: The Electronic Navigational Charts Market is segmented into Type, Application, End User, Distribution Channel, and region. By Type, the market is categorized into Vector Charts, Raster Charts. By Application, the market is categorized into Commercial, and Defense. By End-User, the market is categorized into Shipping Companies, Port Authorities, Government Organizations, and Others. By Distribution Channel, the market is categorized into Online and Offline. By region, it is analyzed across North America (U.S., Canada, Mexico), Eastern Europe (Russia, Bulgaria, The Czech Republic, Hungary, Poland, Romania, Rest of Eastern Europe), Western Europe (Germany, UK, France, Netherlands, Italy, Spain, Rest of Western Europe), Asia Pacific (China, India, Japan, South Korea, Malaysia, Thailand, Vietnam, The Philippines, Australia, New-Zealand, Rest of APAC), Middle East & Africa (Turkiye, Bahrain, Kuwait, Saudi Arabia, Qatar, UAE, Israel, South Africa), South America (Brazil, Argentina, Rest of SA)
Q4: What is the Electronic Navigational Charts Market?
A4: The Electronic Navigational Charts (ENC) Market entails the creation of, and distribution of Geographic Information System (GIS) solutions that are used to navigate through seas and oceans. ENCs are a type of geospatial data that is delivered in standardized form to optimize the safety and efficiency of vessel navigation in an electronic manner in lieu of a paper chart. These charts are very popular in business and military used to improve performance, safety and conformity to IMA rules and regulations.
Q5: How big is the Electronic Navigational Charts Market?
A5: Electronic Navigational Charts Market Size Was Valued at USD 1.15 Billion in 2023, and is Projected to Reach USD 1.85 Billion by 2032, Growing at a CAGR of 5.42% From 2024-2032.
How to Buy a Report from eminsights.jp
On the product page, choose the license you want: Single-User License, Multi-User License or Enterprise License.
If you required report in your native language, then you can click on Translated Report button and fill out the form with report name and language you want, then our team will contact you as soon as possible.
Click the Buy Now button.
You will be redirected to the checkout page. Enter your company details and payment information.
Click Place Order to complete the purchase.
Confirmation: You’ll receive an order confirmation and our team will contact you shortly with your ordered report.
If you have any questions, fill out the contact form below or email us at bizdev@eminsights.net.
Thank you for choosing eminsights.jp!