Stay Ahead in Fast-Growing Economies.
Browse Reports Now
Data Visualization Tools Market Size, Growth Dynamics & Forecast (2024-2032)
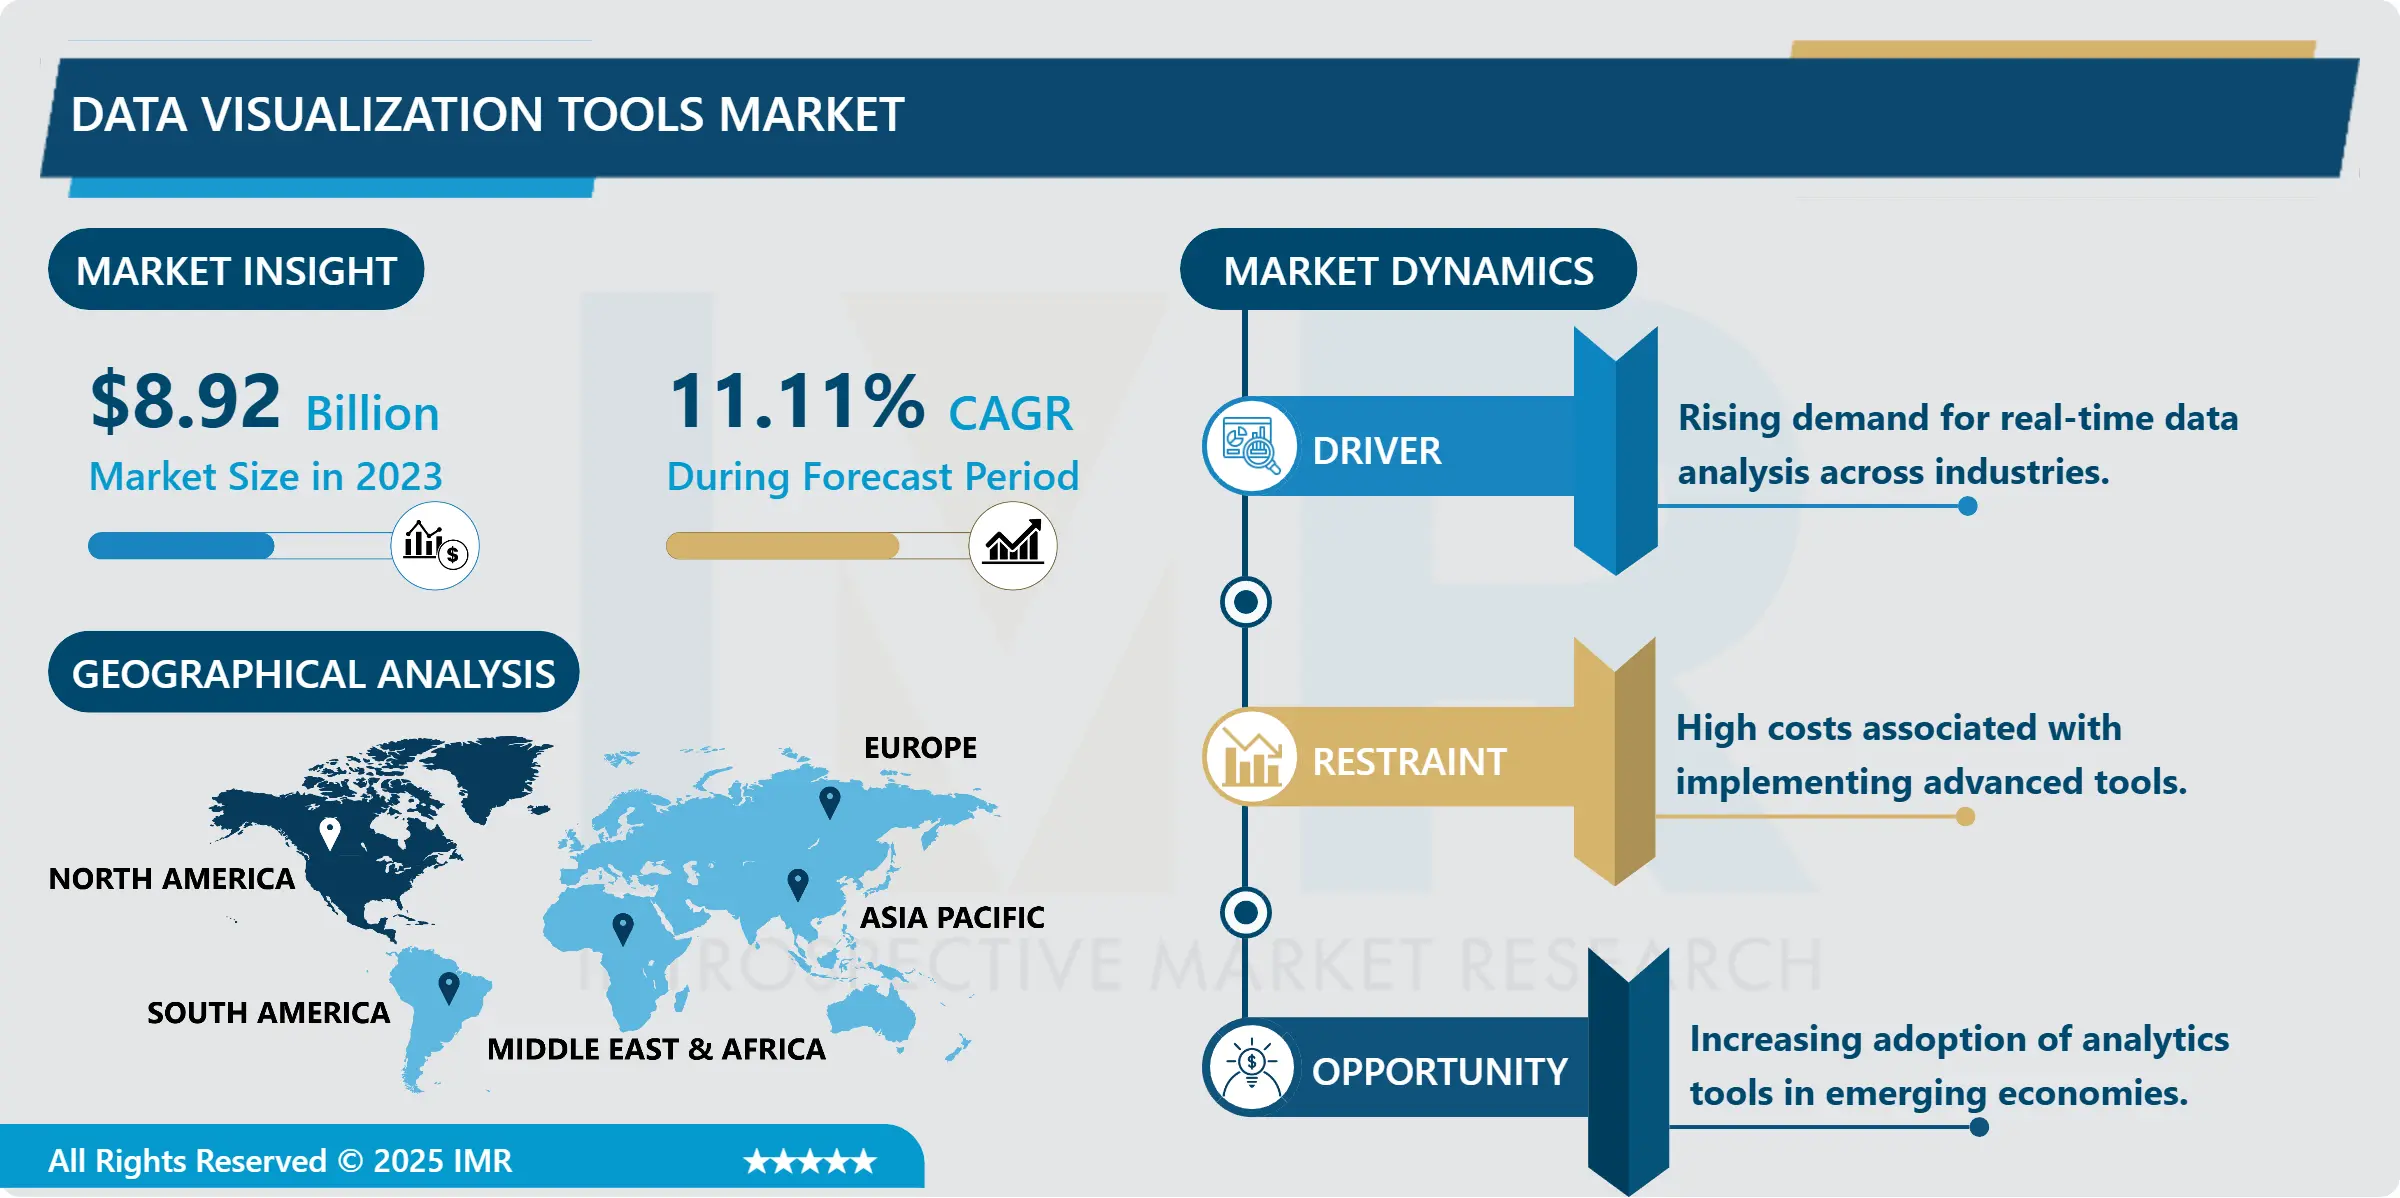
Data Visualization Tools Market Size Was Valued at USD 8.92 Billion in 2023, and is Projected to Reach USD 23.02 Billion by 2032, Growing at a CAGR of 11.11 % From 2024-2032.

IMR Group
Description
Data Visualization Tools Market Synopsis:
Data Visualization Tools Market Size Was Valued at USD 8.92 Billion in 2023, and is Projected to Reach USD 23.02 Billion by 2032, Growing at a CAGR of 11.11 % From 2024-2032.
The Data Visualization Tools Market refers to the industry segment entrenched in tools and applications with capabilities of turning raw data into visual interfaces such as maps, graphs, charts, and dashboards. These tools aid organizations in statistical analysis of large sets of data, data pattern recognition as well as decision-making. The importance for data visualization tools comes from the fact that businesses need to make sense of enormous data sets and gain meaningful insights. It ranges from Retail, Health care, Banking and Financial Services Industry, Information Technology and Telecommunications Industries where visualization is essential to business planning.
The market of data visualization tools has had steady growth as businesses switched to implementing data analysis in their practices. Business enterprises in different parts of the world are creating enormous volumes of data from customer dealings, smart products, and organizational processes, hence the need for visualization tools. They assist organizations to make sense of as well as gain insights from data, achieve better performance, enhance customer experiences, and thus compete effectively despite a cutthroat market. Currently, more and more players, especially in small and medium-sized enterprises (SMEs), are adopting the market due to the availability of cloud-based solutions that can provide scaling and affordability.
In addition, emergence of the modern technologies such as AI and ML has taken a new face to data visualization. These technologies improve predictiveness and automation of the analytical information giving higher value added to the visualization instruments. Real-time dials and customizable interfaces have enhanced the use of dashboards even in such fields that need frequent use of fresh insights. This constant change puts the market on a steady growth path over the forecast period as developed in the subsequent sections
Data Visualization Tools Market Trend Analysis:
Increasing Adoption of AI-Powered Visualization Tools
One of the emerging trends evident in the data visualization tools marketplace is the convergence of AI / ML with the capabilities of visualization platforms. Advanced tools are provided by AI; this increases data facilitating the identification of trends, outlying and probability analysis. These tools also provide intelligent suggestions of the visual formats to the background making the non-technical users to be able to work on the datasets. The need for such intelligent systems is on the rise in industries such as financial services, health care and retail because businesses in these industries need timelier and more accurate data to make decisions.
Growing Adoption in Emerging Markets
Data visualization tools will continue to grow as a market as emerging markets seek to take advantage of this space. Europe and North America are digitizing rapidly, thus generating most of the data and requiring analytics solutions, especially Asia-Pacific and Latin America. Authorities and enterprises in these areas are increasingly deploying IT facilities and utilizing visualization in cloud for their push-button transformations. Here rises the potential for vendors providing cost-efficient solutions with localized characteristics and language availability, targeting subsidiary markets of SMEs and startups.
Data Visualization Tools Market Segment Analysis:
Data Visualization Tools Market Segmented on the basis of deployment, tools, end user and region.
By Deployment, Cloud segment is expected to dominate the market during the forecast period
Tools used for the purpose of data visualization in Bi and Cloud segments will be most popular in the foreseeable future. Cloud based solutions are dominant in today’s markets, proving to have optimum flexibility, optimum scalability and optimum cost effectiveness for business at all levels. All these tools have the capability of integrating with other cloud systems allowing for real time access to information and remote working environment. The large and growing usage of cloud infrastructure across virtually all industry sectors, changes and improved reliability and security of cloud platforms are expected to boost this segment.
By End User, retail and E-Commerce segment expected to held the largest share
The largest market share is expected to be captured by the Retail and E-Commerce segment of the data visualization tools market. More and more retailers are employing data visuals for analyzing consumers’ behavior and sales results, as well as for managing supply chains. Visualization tools are critical in e-commerce to track website traffic, map customer journey and even tailor marketing approaches. The suspicion with online buying coupled with the rising competitiveness in the retail industry has boosted the utilization of improved analytics, leading to the demand for data visualization solutions in this class.
Data Visualization Tools Market Regional Insights:
North America is Expected to Dominate the Market Over the Forecast period
North America region has an advantage because of the large market participants, well-developed technology, as well as a higher application of analytics solutions in every sector. North America still holds largest of the market share and this ratio will remain constant as more and more business organizations are adopting data-driven decision making.
In the United States specifically, businesses are pressured tremendously to employ Brain Science analytics and real-time visualization. Technological readiness and customer-centric approaches to business also prove the extended utilization of visualization tools in the region. At the same time, higher penetration of cloud services and the developing technosphere in Canada also play a role in the regional market growth. Since business organizations in North America are increasingly tapping into data visualization to get a competitive edge the market will continue expanding expeditiously.
Active Key Players in the Data Visualization Tools Market:
Alteryx (United States)
Domo (United States)
Google LLC (United States)
BM Corporation (United States)
Infor (United States)
Microsoft Corporation (United States)
MicroStrategy (United States)
Oracle Corporation (United States)
QlikTech International (United States)
Salesforce (United States)
SAP SE (Germany)
Sisense (United States)
Tableau Software (United States)
ThoughtSpot (United States)
Zoho Corporation (India)
Other Active Players
Chapter 1: Introduction
1.1 Scope and Coverage
Chapter 2:Executive Summary
Chapter 3: Market Landscape
3.1 Market Dynamics
3.1.1 Drivers
3.1.2 Restraints
3.1.3 Opportunities
3.1.4 Challenges
3.2 Market Trend Analysis
3.3 PESTLE Analysis
3.4 Porter’s Five Forces Analysis
3.5 Industry Value Chain Analysis
3.6 Ecosystem
3.7 Regulatory Landscape
3.8 Price Trend Analysis
3.9 Patent Analysis
3.10 Technology Evolution
3.11 Investment Pockets
3.12 Import-Export Analysis
Chapter 4: Data Visualization Tools Market by Deployment
4.1 Data Visualization Tools Market Snapshot and Growth Engine
4.2 Data Visualization Tools Market Overview
4.3 On-Premise
4.3.1 Introduction and Market Overview
4.3.2 Historic and Forecasted Market Size in Value USD and Volume Units (2017-2032F)
4.3.3 Key Market Trends, Growth Factors and Opportunities
4.3.4 On-Premise: Geographic Segmentation Analysis
4.4 Cloud
4.4.1 Introduction and Market Overview
4.4.2 Historic and Forecasted Market Size in Value USD and Volume Units (2017-2032F)
4.4.3 Key Market Trends, Growth Factors and Opportunities
4.4.4 Cloud: Geographic Segmentation Analysis
Chapter 5: Data Visualization Tools Market by Tools
5.1 Data Visualization Tools Market Snapshot and Growth Engine
5.2 Data Visualization Tools Market Overview
5.3 Standalone Integrated
5.3.1 Introduction and Market Overview
5.3.2 Historic and Forecasted Market Size in Value USD and Volume Units (2017-2032F)
5.3.3 Key Market Trends, Growth Factors and Opportunities
5.3.4 Standalone Integrated: Geographic Segmentation Analysis
Chapter 6: Data Visualization Tools Market by End User
6.1 Data Visualization Tools Market Snapshot and Growth Engine
6.2 Data Visualization Tools Market Overview
6.3 BFSI IT and Telecom Retail and E-commerce Healthcare Manufacturing Government Others
6.3.1 Introduction and Market Overview
6.3.2 Historic and Forecasted Market Size in Value USD and Volume Units (2017-2032F)
6.3.3 Key Market Trends, Growth Factors and Opportunities
6.3.4 BFSI IT and Telecom Retail and E-commerce Healthcare Manufacturing Government Others: Geographic Segmentation Analysis
Chapter 7: Company Profiles and Competitive Analysis
7.1 Competitive Landscape
7.1.1 Competitive Benchmarking
7.1.2 Data Visualization Tools Market Share by Manufacturer (2023)
7.1.3 Industry BCG Matrix
7.1.4 Heat Map Analysis
7.1.5 Mergers and Acquisitions
7.2 ALTERYX (UNITED STATES)
7.2.1 Company Overview
7.2.2 Key Executives
7.2.3 Company Snapshot
7.2.4 Role of the Company in the Market
7.2.5 Sustainability and Social Responsibility
7.2.6 Operating Business Segments
7.2.7 Product Portfolio
7.2.8 Business Performance
7.2.9 Key Strategic Moves and Recent Developments
7.2.10 SWOT Analysis
7.3 DOMO (UNITED STATES)
7.4 GOOGLE LLC (UNITED STATES)
7.5 BM CORPORATION (UNITED STATES)
7.6 INFOR (UNITED STATES)
7.7 MICROSOFT CORPORATION (UNITED STATES)
7.8 MICROSTRATEGY (UNITED STATES)
7.9 ORACLE CORPORATION (UNITED STATES)
7.10 QLIKTECH INTERNATIONAL (UNITED STATES)
7.11 SALESFORCE (UNITED STATES)
7.12 SAP SE (GERMANY)
7.13 SISENSE (UNITED STATES)
7.14 TABLEAU SOFTWARE (UNITED STATES)
7.15 THOUGHTSPOT (UNITED STATES)
7.16 ZOHO CORPORATION (INDIA)
7.17 OTHER ACTIVE PLAYERS
Chapter 8: Global Data Visualization Tools Market By Region
8.1 Overview
8.2. North America Data Visualization Tools Market
8.2.1 Key Market Trends, Growth Factors and Opportunities
8.2.2 Top Key Companies
8.2.3 Historic and Forecasted Market Size by Segments
8.2.4 Historic and Forecasted Market Size By Deployment
8.2.4.1 On-Premise
8.2.4.2 Cloud
8.2.5 Historic and Forecasted Market Size By Tools
8.2.5.1 Standalone Integrated
8.2.6 Historic and Forecasted Market Size By End User
8.2.6.1 BFSI IT and Telecom Retail and E-commerce Healthcare Manufacturing Government Others
8.2.7 Historic and Forecast Market Size by Country
8.2.7.1 US
8.2.7.2 Canada
8.2.7.3 Mexico
8.3. Eastern Europe Data Visualization Tools Market
8.3.1 Key Market Trends, Growth Factors and Opportunities
8.3.2 Top Key Companies
8.3.3 Historic and Forecasted Market Size by Segments
8.3.4 Historic and Forecasted Market Size By Deployment
8.3.4.1 On-Premise
8.3.4.2 Cloud
8.3.5 Historic and Forecasted Market Size By Tools
8.3.5.1 Standalone Integrated
8.3.6 Historic and Forecasted Market Size By End User
8.3.6.1 BFSI IT and Telecom Retail and E-commerce Healthcare Manufacturing Government Others
8.3.7 Historic and Forecast Market Size by Country
8.3.7.1 Russia
8.3.7.2 Bulgaria
8.3.7.3 The Czech Republic
8.3.7.4 Hungary
8.3.7.5 Poland
8.3.7.6 Romania
8.3.7.7 Rest of Eastern Europe
8.4. Western Europe Data Visualization Tools Market
8.4.1 Key Market Trends, Growth Factors and Opportunities
8.4.2 Top Key Companies
8.4.3 Historic and Forecasted Market Size by Segments
8.4.4 Historic and Forecasted Market Size By Deployment
8.4.4.1 On-Premise
8.4.4.2 Cloud
8.4.5 Historic and Forecasted Market Size By Tools
8.4.5.1 Standalone Integrated
8.4.6 Historic and Forecasted Market Size By End User
8.4.6.1 BFSI IT and Telecom Retail and E-commerce Healthcare Manufacturing Government Others
8.4.7 Historic and Forecast Market Size by Country
8.4.7.1 Germany
8.4.7.2 UK
8.4.7.3 France
8.4.7.4 The Netherlands
8.4.7.5 Italy
8.4.7.6 Spain
8.4.7.7 Rest of Western Europe
8.5. Asia Pacific Data Visualization Tools Market
8.5.1 Key Market Trends, Growth Factors and Opportunities
8.5.2 Top Key Companies
8.5.3 Historic and Forecasted Market Size by Segments
8.5.4 Historic and Forecasted Market Size By Deployment
8.5.4.1 On-Premise
8.5.4.2 Cloud
8.5.5 Historic and Forecasted Market Size By Tools
8.5.5.1 Standalone Integrated
8.5.6 Historic and Forecasted Market Size By End User
8.5.6.1 BFSI IT and Telecom Retail and E-commerce Healthcare Manufacturing Government Others
8.5.7 Historic and Forecast Market Size by Country
8.5.7.1 China
8.5.7.2 India
8.5.7.3 Japan
8.5.7.4 South Korea
8.5.7.5 Malaysia
8.5.7.6 Thailand
8.5.7.7 Vietnam
8.5.7.8 The Philippines
8.5.7.9 Australia
8.5.7.10 New Zealand
8.5.7.11 Rest of APAC
8.6. Middle East & Africa Data Visualization Tools Market
8.6.1 Key Market Trends, Growth Factors and Opportunities
8.6.2 Top Key Companies
8.6.3 Historic and Forecasted Market Size by Segments
8.6.4 Historic and Forecasted Market Size By Deployment
8.6.4.1 On-Premise
8.6.4.2 Cloud
8.6.5 Historic and Forecasted Market Size By Tools
8.6.5.1 Standalone Integrated
8.6.6 Historic and Forecasted Market Size By End User
8.6.6.1 BFSI IT and Telecom Retail and E-commerce Healthcare Manufacturing Government Others
8.6.7 Historic and Forecast Market Size by Country
8.6.7.1 Turkiye
8.6.7.2 Bahrain
8.6.7.3 Kuwait
8.6.7.4 Saudi Arabia
8.6.7.5 Qatar
8.6.7.6 UAE
8.6.7.7 Israel
8.6.7.8 South Africa
8.7. South America Data Visualization Tools Market
8.7.1 Key Market Trends, Growth Factors and Opportunities
8.7.2 Top Key Companies
8.7.3 Historic and Forecasted Market Size by Segments
8.7.4 Historic and Forecasted Market Size By Deployment
8.7.4.1 On-Premise
8.7.4.2 Cloud
8.7.5 Historic and Forecasted Market Size By Tools
8.7.5.1 Standalone Integrated
8.7.6 Historic and Forecasted Market Size By End User
8.7.6.1 BFSI IT and Telecom Retail and E-commerce Healthcare Manufacturing Government Others
8.7.7 Historic and Forecast Market Size by Country
8.7.7.1 Brazil
8.7.7.2 Argentina
8.7.7.3 Rest of SA
Chapter 9 Analyst Viewpoint and Conclusion
9.1 Recommendations and Concluding Analysis
9.2 Potential Market Strategies
Chapter 10 Research Methodology
10.1 Research Process
10.2 Primary Research
10.3 Secondary Research
Q1: What would be the forecast period in the Data Visualization Tools Market Research report?
A1: The forecast period in the Data Visualization Tools Market Research report is 2024-2032.
Q2: Who are the key players in the Data Visualization Tools Market?
A2: Alteryx (United States), Domo (United States), Google LLC (United States), IBM Corporation (United States), Infor (United States), Microsoft Corporation (United States), MicroStrategy (United States), Oracle Corporation (United States), QlikTech International (United States), Salesforce (United States), SAP SE (Germany), Sisense (United States), Tableau Software (United States), ThoughtSpot (United States), Zoho Corporation (India), Other Active Players.
Q3: What are the segments of the Data Visualization Tools Market?
A3: The Data Visualization Tools market is segmented into Deployment Tools, End User, and Region. By Deployment, the market is categorized into On-Premise and Cloud. By Tools, the market is categorized into Standalone and integrated. By End User, the market is categorized into BFSI IT and Telecom Retail and E-commerce Healthcare Manufacturing Government Others. By region, it is analyzed across North America (U.S.; Canada; Mexico), Eastern Europe (Russia; Bulgaria; The Czech Republic; Hungary; Poland; Romania; Rest of Eastern Europe), Western Europe (Germany; UK; France; Netherlands; Italy; Spain; Rest of Western Europe), Asia-Pacific (China; India; Japan; Southeast Asia, etc.), South America (Brazil; Argentina, etc.), Middle East & Africa (Saudi Arabia; South Africa, etc.).
Q4: What is the Data Visualization Tools Market?
A4: The Data Visualization Tools Market refers to the industry segment entrenched in tools and applications with capabilities of turning raw data into visual interfaces such as maps, graphs, charts, and dashboards. These tools aid organizations in the statistical analysis of large sets of data, data pattern recognition as well as decision-making. The importance for data visualization tools comes from the fact that businesses need to make sense of enormous data sets and gain meaningful insights. It ranges from Retail, Health care, Banking and Financial Services Industry, Information Technology, and Telecommunications Industries where visualization is essential to business planning.q
Q5: How big is the Data Visualization Tools Market?
A5: Data Visualization Tools Market Size Was Valued at USD 8.92 Billion in 2023, and is Projected to Reach USD 23.02 Billion by 2032, Growing at a CAGR of 11.11 % From 2024-2032.
How to Buy a Report from eminsights.jp
On the product page, choose the license you want: Single-User License, Multi-User License or Enterprise License.
If you required report in your native language, then you can click on Translated Report button and fill out the form with report name and language you want, then our team will contact you as soon as possible.
Click the Buy Now button.
You will be redirected to the checkout page. Enter your company details and payment information.
Click Place Order to complete the purchase.
Confirmation: You’ll receive an order confirmation and our team will contact you shortly with your ordered report.
If you have any questions, fill out the contact form below or email us at bizdev@eminsights.net.
Thank you for choosing eminsights.jp!